The foundation of our coaching at Driveline is the athlete assessment, which includes data collection using various baseball technologies. These innovative tools are helping us help our athletes more than ever, because we don’t have to guess anymore. When we tell a hitter something about their swing, we have data to support it.
I must admit (because I’ve seen it first hand), that pitching development via technology outraced hitting development, but it’s time to start gaining some ground back.
Now we can collect data on batted balls and swing kinematics in real time and in training. At Driveline, I have the luxury of being able to have access to these tools and groups of athletes. However, the question remained, “how do I use this to make hitters better?” We spend a lot of time and energy in learning how to properly collect all this data, and most importantly, how to make it actionable and usable for coaches working in the cages. And how we apply this all comes down to our assessment.
![]()
Why Do You Need to Assess Your Hitters?
Greg Rose asks a great question: “Why guess when you can assess?” When working with athletes, it’s our job to make sure that we are getting them better.
Step one in that process is establishing the areas of improvement. For a number of reasons, assessing hitters has typically been done by watching them swing, and then suggesting ways to improve based on what the coach perceives as in need of improvement. Many coaches have an incredible eye for this, and have helped hitters tremendously just based off what they can see with their naked eye and with video.
However, it is a general frustration for hitters, as they will hit with X number of coaches and get X number of things that they need to improve. The opinions of various coaches, which may or may not be true, often contradict one another. Fortunately for us, technology has empowered us with the tools to take most of the guessing out of it, and begin to objectively measure the things that matter. We don’t have to guess anymore.
It’s my opinion that technology will never replace the coaches, but the coaches who knows how to use the technology will replace those who don’t.
When we run assessments, we don’t just hand the athlete a spreadsheet with their data and tell them to fix it. The assessment and data collection is simply a tool that can help us coaches do our jobs better, and the data is only as valuable as it is applied. Coaches often see this stuff as a threat, when in actuality its just a tool to help you help your athletes. This is how it helps us:
Our basic model at Driveline is the Test-Retest Model
- Driveline trainers assess the athlete, starting on their first day training with us.
- Collect Data (batted ball profile, swing kinematics, strength and mobility)
- Run analysis on data
- Target areas for improvement
- We design a program to improve targeted areas
- Using data from the assessment, we can design individualized programming tackling the athlete’s biggest limiting factors to performance
- Set objective goals for the athlete
- We re-test.
- Every 2-3 weeks, analyze their data
- See what has improved and what hasn’t
- Update programming
- Make changes in training phase (bat speed, attack angle, etc)
- And this cycle repeats itself.
So, What do we Measure?
Note: all assessment data is collected when hitting off of a pitching machine at game-speed velocity.
Batted Ball Profile
How the ball comes off the bat is extremely valuable feedback. Coaches and scouts have always used ball fight or the sound of contact as feedback on the hitter. Using a HitTrax and/or Rapsodo Hitting, we can get a much more reliable assessment. We collect every batted ball at Driveline and run analysis on it to generate reports. In a week, we can get an entire season’s worth of batted balls to help us understand the hitter. During an assessment, we can collect roughly an MLB season’s worth of batted balls (~300) against a high-speed pitching machine in just one week. Often people think that we just use peak exit velocity and average launch angle of batted balls, but as you’ll see, it’s much more complex than that.
*The examples/images of graphs below are of various hitters we’ve had in the facility*
Exit Velocity
Peak Exit Velo
Peak exit velo is important. To become a pro, there is typically a threshold you much surpass to even be considered. Every pro that has ever hit at Driveline has hit a ball 100 MPH. Because it was easier to measure pitching velocity, pitchers are accustomed to benchmarking their velocity as a component of their performance. Today, pitchers are very unlikely to play professional baseball today if you throw 85 MPH. Hitting is no different.
More Exit Velo Data
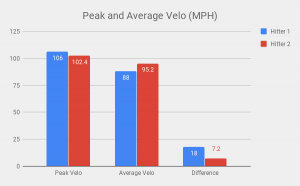
Being capable of hitting the ball hard is one thing. Being able to hit it hard consistently is another, and a large separator between successful hitters at every level. But looking at just average exit velo isn’t enough. For that reason we measure average EV, hard hit% (percentage of balls hit >90% of your peak), barrel consistency (average velo/peak velo), exit velocity within certain launch angle windows, and the standard deviation of exit velocity. All are slightly unique indicators of how consistently the hitter hits the ball hard, and can tell us not only that he can move the bat fast, but with quickness and precision.
![]()
Exit Velocity. Hitter 1 can hit the ball harder, but hitter 2 hits the ball hard more consistently.
![]()
How hard does the hitter hit the ball? At what angles? How does it compare to our pro data?
We will also split it up to see if the hitter has an deficiencies to a certain part of the field or certain area of the strike zone.
By Field
![]()
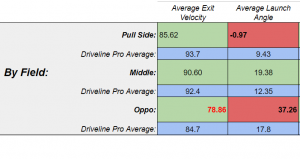
How does your data look by field?
![]()
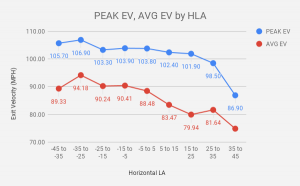
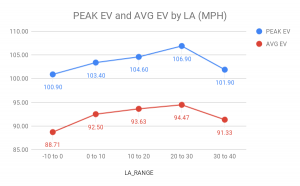
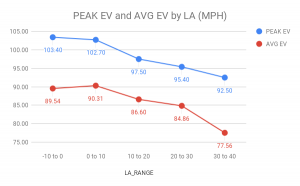
What is the hitter’s peak and Average EV by Horizontal LA? (right handed hitter, -45 is left field line, 45 is right field line)
![]()
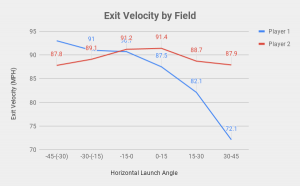
A comparison of average EV by HLA for two right handed hitters. Hitter 1 loses EV as he goes oppo, while the other maintains EV to all fields.
By Launch Angle
![]()
What is the hitter’s Peak and Average EV based on launch angle? Note: this hitter has an average attack angle of 18.
![]()
Note: this hitter has an average attack angle of -3.5.
By Depth
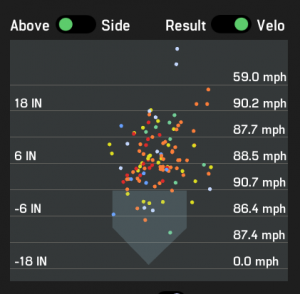
HitTrax gives us data on the depth of batted balls, so we can run analysis based on how deep or out front they are making contact.
![]()
Example of HitTrax point of contact data on two hitters from a hitting session![]()
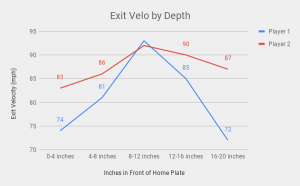
![]()
Hitter 1 has a higher peak exit velocity, but a smaller “sweet spot” for depth, whereas hitter 2 can hit balls hard within a wider range of depth.
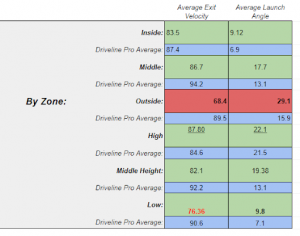
Peak and Average EV by zone
![]()
How does the hitter hit the ball in different areas of the strike zone?
Launch Angle
Looking at a hitter’s launch angle can tell us a lot about his swing. Instead of just looking only at the average launch angle, we dive really deep into the data to learn about the hitter. We look at launch angle based on pitch location, point of contact depth, or field. (For instance: one of the most common flaws we see within a batted ball profile are a very low launch angles to the pull side. A very small percentage of our hitters can successfully pull the ball with a high exit velo at a good launch angle)
We also look at the launch angle of a hitter’s hardest hit balls, as it can tell us about their attack angle. We look at their average launch angle of hard hit balls compared to their average launch angle overall, and their distribution of mishits to get an idea of where they are going wrong. We look at the percentage of balls that a hitter hits within 10-35 degrees and the standard deviation of launch angle to see how often they are squaring it up. These are just a few examples, but understanding a hitter is a complex problem, and we look at many aspects of launch angle to get an full picture of their swing. Here are some visual examples of how we use launch angle to diagnose swing flaws.
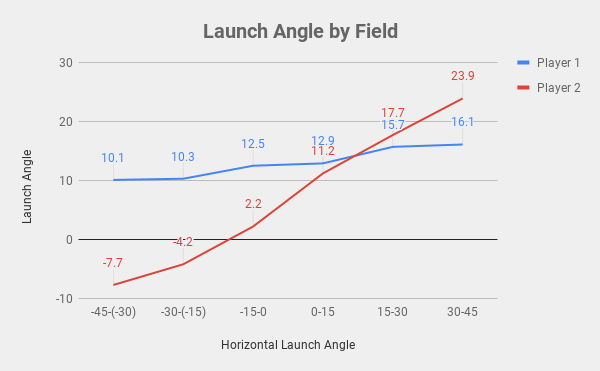
![]()
A comparison of two right handed hitter’s average LA by HLA. Hitter 2’s LA is very determined by his HLA (aka Spray Angle)
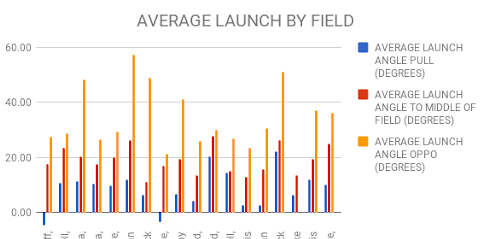
![]()
From a Team Assessment; average LA by field for each hitter.
![]()
What is the hitter’s average launch angle, average launch angle of hard hit balls (balls hit with EV >90% of peak EV), and standard deviation of launch angle?
Blast
We use Blast Motion to track our hitter’s progress in a few areas. Primarily, we look at bat speed, hand speed, attack angle and time to impact. This is a tremendously valuable way to assess your hitters, and to target potential areas for improvement. It shouldn’t come as a surprise that our better hitters swing the bat faster, generally speaking. (Our current average bat speed of pro hitters is 6.2 mph faster than our undrafted but draft-eligible college players).
Attack angle is the vertical angle that the bat is going at impact. I encourage all our hitters to have an average attack angle between 5-15 degrees, like most pros. (Ideal attack angle windows will vary depending on bat speed). A very large percentage of our college summer trainees displayed negative attack angles during their assessment. In many cases, hitters possessed enough bat speed to be an elite college hitter, but with a negative attack angle, they weren’t able to efficiently strike the ball. These players typically lost exit velo as they climb the launch angle ladder, and waste a lot of their bat speed by hitting their hardest balls on the ground. These players get put onto our “attack angle” phase of training.
![]()
2 week improvement for a college hitter this summer. Disclaimer: it’s not typical to see gains this large in such a short period of time.
K-Vest
![]()
K-Vest gives us kinematic data on hitters. This graph shows rotational velocity over time of the pelvis, torso, lead arm and lead hand. We can tell if a hitter is moving out of sequence, or is lacking speed gain between segments of the kinetic chain.
Example: Imagine two hitter’s both have the same pelvis rotational speed, but one is able to transfer energy up the chain and rotate his torso much faster. The hitter with the poor speed gain could have an number of issues (technique issue, lack of strength, lack of separation, lack of mobility in thoracic spine, etc). This is when we would check the video, look at other assessment data, and work with the athlete to try to figure out the why and fix it.
K-Vest also gives us data on posture/positions of the pelvis and torso throughout the swing. We measure position in 3 planes (turn, bend and side bend) throughout the swing, and we can compare a hitters positions to the average and standard deviations from our a database of affiliated professional hitters. We have a lot to learn, but being able to flag potential issues with positioning has helped us work with hitters and design their swing/make tweaks with their set up to ensure they are in a position to move efficiently. It also gives us degrees of hip-shoulder separation throughout the swing, which has been very valuable so far.
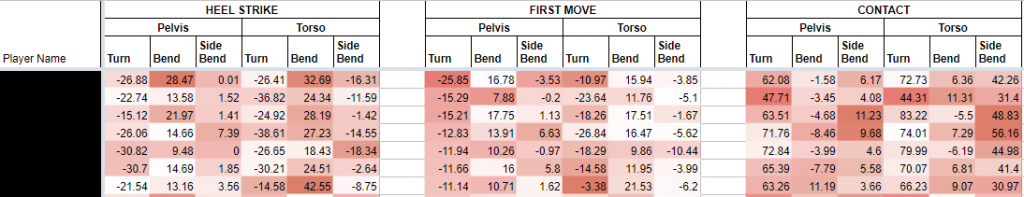
![]()
Analyzing positions throughout the swing with K-Vest. With conditional cell formatting set based on pro averages and standard deviations, we can flag potential swing issues. Positions as defined by K-Vest Heel Strike: beginning of hip forward rotation. First Move: when the hands begin to move towards the pitcher
Physical Screen
Our athletes go through a comprehensive physical screen. Many times, we can discover the “what” by looking at hitter’s batted ball profile or kinematics, but the psychical screen often tells us the “why.”
For instance, if we had a hitter who lacked the ability to quickly decelerate his pelvis, as measured by K-Vest, the first thing I’d look for is stability and internal rotation range of motion in his lead/blocking leg.
Integration with strength and medical is critical to our training at Driveline, and our assessment in our area can help point us in the right direction for another.
![]()
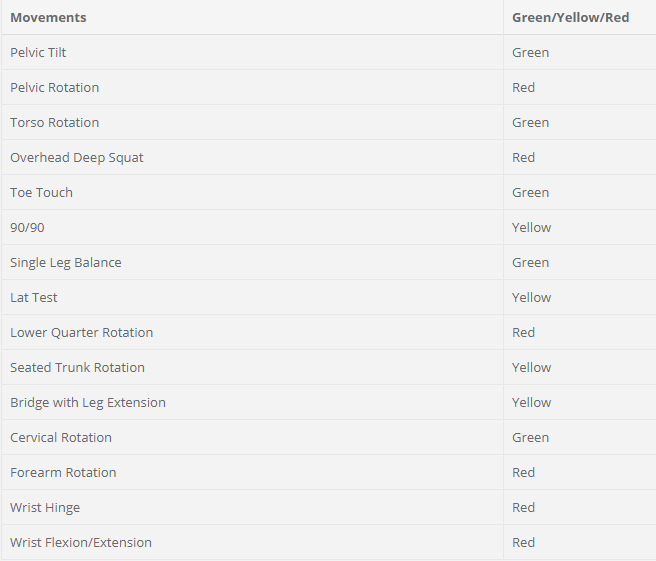
TPI Movement Screen
Hitters will go through: a full TPI movement screen, manual muscle test, PRI assessments, upper and lower limb tension test, active ROM test, Faber test, VBT test, strength tests and others.
Here are a few screenshots from TRAQ, (the internal tracking software we developed to help ourselves and other teams manage data), displaying things we measure during our assessment.
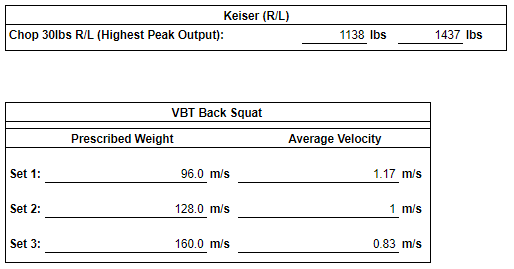
![]()
VBT (velocity based training) numbers
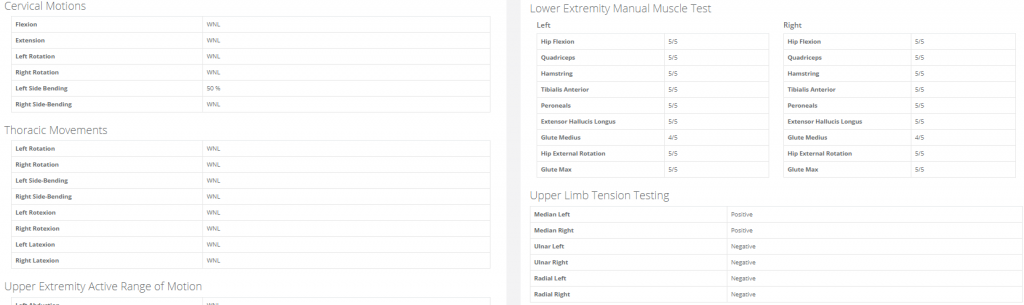
![]()
![]()
Some data from our range of motion and Mobility Screen
Meeting with Athletes- Helping Them Apply the Data
So, once we accumulate all of this data, what do we do with it? The application of this information is truly what matters.
The assessment data needs to be understood and made actionable by our coaching staff.
At the end of the assessment, the hitter will sit down with the coach to go over their report. At the end of the meeting, I want one thing to be clear to the athlete: What are you working to improve, and how are you going to get there? I think the most powerful thing that the assessment creates is objective goals for each athlete. At the end of the meeting, we will have objective goals set for each hitter. So, when they come in every day, they have a deliberate plan as to what they are trying to accomplish. Far too many hitters just go into the cage without a plan, and end up never getting any better.
Training without a plan is just guessing.
The depth at which I’ll go over the data with the athlete depends on the athlete. The last thing I want to do is paralyze the athlete with numbers. If the athlete shows interest in analyzing the data and is able to comprehend it, I’m more than happy to do so. I love working with these “future coach” type of hitters. However, some of my favorite trainees are the ones who say “Jason, I trust you and your program. That’s why I’m paying. That’s why I’m here. Just tell me what to do every day and I’ll do it.”
We at Driveline have the luxury of being able to study this stuff full time. The truth is, most athletes don’t have the technical knowledge we have in data analysis, biomechanics, kinesiology, motor learning or really any aspect of sports science. That’s okay. Most hitters don’t want a math or biomechanics lesson, and its highly probably that it would do more harm than good anyway. They want to train and get after it, and be guided by an expert. I used to resent athletes that felt this way, but I’ve grown to respect it.
Another function of the athlete meeting is to go over the plan and, whether or not they want to dive into the data, I want to give the athlete some ownership. Coaching here is different than my previous experience as a college coach because the athlete is paying to be here, and we are basically working for them. We work with professional hitters who spend their offseason away from home to train, so I want to serve them as best as possible, and communication is key.
It goes like this: “The report shows your areas of improvement to be ___,___,___. _____ is what I suggest and why. These are the different ways we can go about it. What do you want to do?”
An example of that would be a hitter who displays very poor batted ball metrics on the outside pitch. I will tell them: “we can design your program to patch this hole in your swing, or you can just learn to never swing at those pitches unless you have to.”
Or if they have large dropoff in EV to the opposite field. We can either learn to hit the ball better that way, or just learn to not go oppo. Both are good options for some hitters, and a lot of variables are considered when making these decisions:
How long are you going to train for? If you come to me 2 weeks before spring training and we see a major hole in your swing, I’d be less open to patching the hole, and more likely to encourage you to learn to be best with what you have.
Where are you developmentally? I’m not concerned about your LA on balls to the opposite field if you’re 21 years old and your peak EV is 94 mph. Any and all training economy needs to be allocated towards developing bat speed and rotational velocity.
Programming
Once the assessment is done, we will put the athlete on programming designed to target their specific training goals. Using our TRAQ software, we have built out templates for various hitting programs. ![]()
If they get the assessment and train at home, we will retest once they revisit the gym. If they stay at Driveline, we will retest after 2-3 weeks of training to see if the programming has been successful in fixing what we’ve targeted as “in need of improvement.” The test-retest model holds both athlete and coach accountable.
If a hitter gets an assessment and decides he needs to work on say, bat speed and swing depth, then he deserves to know if the program is working, and we can measure it. Many hitters train days on end and go in circles, not ever improving, because they have no idea if what they are doing is actually working. Skills are acquired incrementally over time, and technology has allowed us to track that progress and immediately make adjustments if an athlete begins to plateau.
This is just an introduction to our assessment and a deeper glimpse into how we approach our training of hitters at Driveline. The term “data-driven” is not just a buzzword. Our training is driven by our data, and when that level of information is coupled with effective coaching skills, we can help our hitters better than ever.
The post An Introduction to Driveline Hitting Assessments: The Why, What and How appeared first on Driveline Baseball.